

Shared Living Has Always Existed in Australia. Now It's Being Built for Purpose.
A factual examination of Victoria's share accommodation market, the structural forces driving demand, and how purpose-built co-living formalises what has always been part of Australian housing. For tenants, it means privacy and comfort that traditional share houses cannot offer. For investors, it means one property with multiple rental income streams.
Why a well-designed co-living build in the right location works
When one resident leaves a 7-room build, six rents keep flowing — roughly 86% of income continues.
Industry commentary cites 6–15% gross for co-living vs 3–5% for traditional rentals.
A purpose-built design Rooming House in Metropolitan Melbourne and some regional locations were appraised at $360–$400 per room per week — design, not just location, drove it.
Private rooms with private en-suites remove the #1 share-house complaint — and preferred products stay occupied.
1.7 million Victorian renters, tight vacancy, and demand spreading across the metro area.
Licensed under Victoria's rooming house framework, buildable as residential Class 1b or commercial Class 3.
Each point is expanded with sources throughout this page. Indicative figures only — not financial advice.
Shared accommodation is not a new concept. It has been a consistent feature of Australian housing for decades.
At the 2021 Census, 713,277 Victorian households were renting — 28.4% of all households. That's a 15.6% increase from 2016 (616,990) and a 35.7% increase from 2011 (525,605). Nearly 1.7 million Victorians were renters — 11.5% more than five years earlier.
Group households make up 9.5% of all Victorian rental households — approximately 67,760 group renter households. Alongside one-person renters (31.0%), they are the household types most directly served by purpose-built co-living.
What has changed is not the demand for shared living. What has changed is the quality and management of the properties that serve it. Purpose-built co-living is simply the formalisation of shared accommodation into properly designed, professionally managed dwellings.
- 713,277 Victorian households rent (+35.7% since 2011). 9.5% of them — around 67,760 households — are group renters. That's the addressable base for purpose-built co-living.
Group & other households in Victoria: 135,000 (2021) → 179,000 (2036)
Source: Victoria in Future 2023 — the Victorian Government's official household projections.
For investors, this is the key forward-looking figure: an official state projection showing structural, growing demand for shared and flexible housing through 2036. Total Victorian households are projected to rise from 2.57 million to 3.36 million, while average household size stays flat at 2.5 — the demographic support for smaller, more flexible household formats does not go away.
Historical context: earlier AHURI modelling (Final Report No. 38, based on 1996–2011 Census data) recorded double-digit group-household growth in every Victorian region across that window — for example West Melbourne +70%, South Melbourne +62%, Barwon (Geelong) +54%. That series is retained here only as historical background; the current, authoritative view is Victoria in Future 2023 above.
The forces driving shared accommodation demand are structural, not cyclical
Multiple interlocking forces have been driving demand for shared accommodation for decades. These are not temporary market conditions. They are long-term demographic and economic shifts documented by the ABS, AHURI, and the Victorian Parliament.
The Victorian Parliament's 2023 inquiry found the rental market is being squeezed from both ends — by higher-income earners who in the past would have been owner-occupiers, and by lower-income renters with fewer affordable options. Share accommodation is where that squeeze resolves.
Average household size fell from 3.3 persons (1971) to 2.5 persons (2021)
Outright ownership fell from over 40% (1994–95) to 32.2% (2021) in Victoria
Renting grew from 27.5% to 30.6% of Victorians between 2016 and 2021
Median Melbourne rent reached $580/week (Sept 2025). Unit rents up 46.9% since March 2021
Victoria's population projected to reach 11.2 million by 2056, from 5.9 million in 2016
Projected +33% in Victoria — from 135,000 (2021) to 179,000 by 2036 — an additional 44,000 shared-style households
- Smaller households, fewer owners, more renters, higher rents — every long-term force points toward more shared living, not less.
Housing supply is not keeping pace with demand
The National Housing Supply and Affordability Council's 2024 report establishes that new housing supply will consistently fall short of underlying demand throughout the 2020s. Victoria's Housing Statement targets 800,000 new homes over 10 years (2024–2034), but current construction rates are materially below this pace.
This supply gap structurally entrenches share accommodation as a necessary housing solution for hundreds of thousands of Victorians. The demand is not speculative. It is documented, measured, and growing.
Demand drivers that extend the case well beyond current cycles
Demand in Melbourne is likely to keep spreading outward into middle-ring and outer-middle suburbs with good rail access and lower entry price points. The investment question is not whether demand exists — it is where product, price, planning and operations can be aligned to capture it compliantly and at scale.
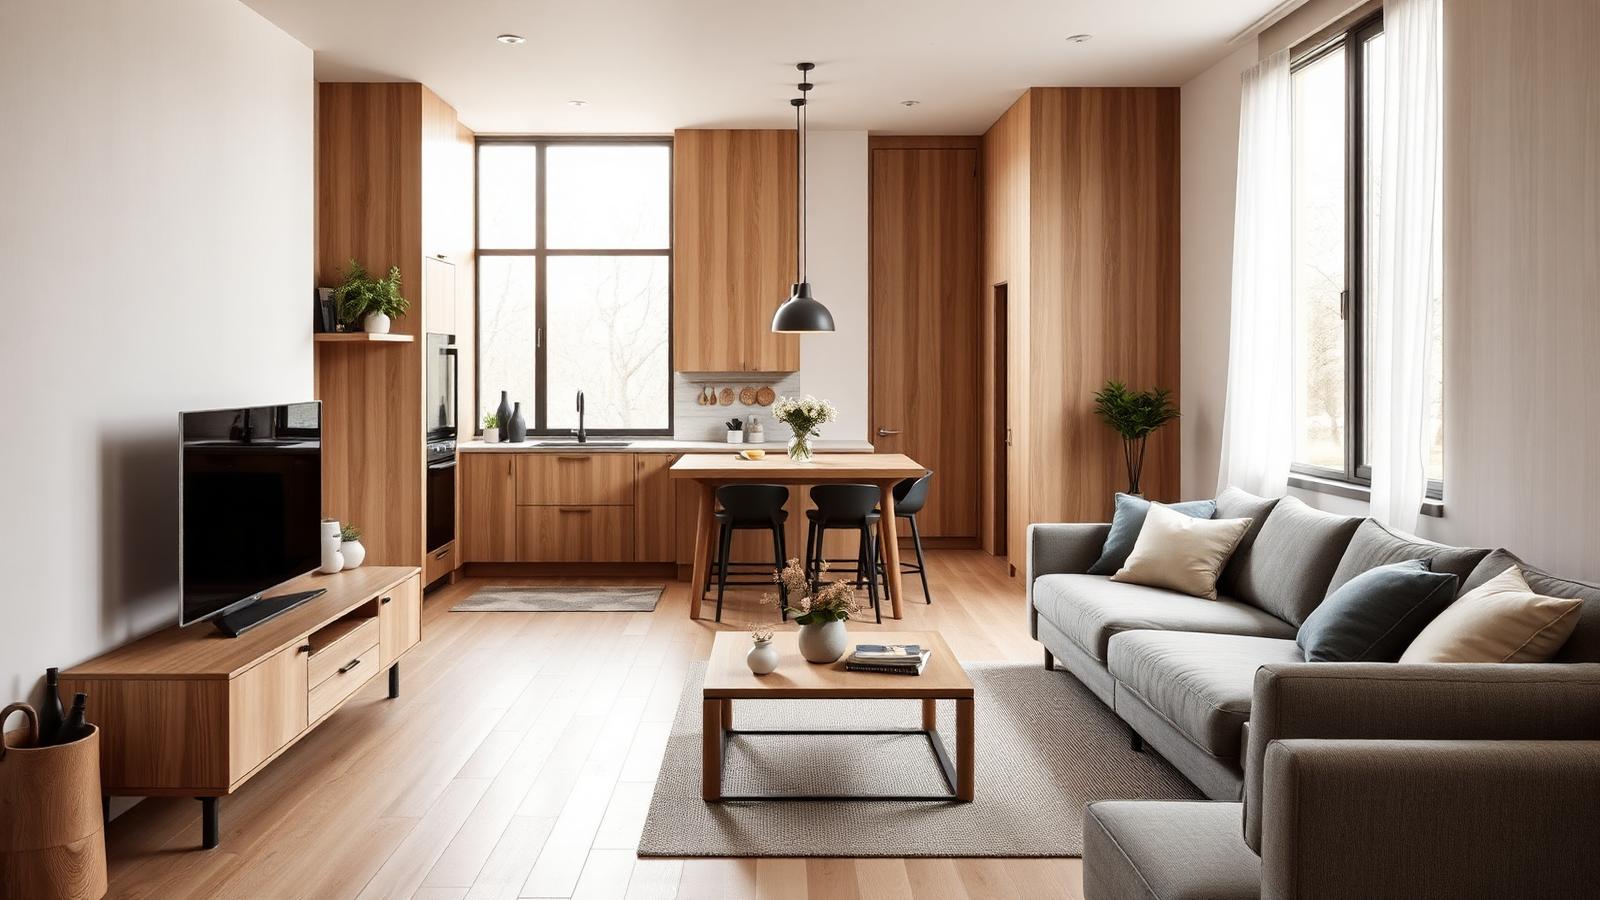
Purpose-built co-living is not a new idea. It is shared living, formalised and better managed.
Australians have always shared housing. From boarding houses in the early 1900s to share houses in every suburb today, shared accommodation has been a constant feature of how people live. What has changed is the standard of the built environment and the quality of management.
Purpose-built co-living properties are designed from the ground up for multiple independent adults. They include properly sized private rooms (often with en-suites), high-quality shared kitchens and living areas, and are managed by professionals under Victoria's rooming house licensing framework.
Victoria's regulatory reforms, including the Rooming House Operators Licensing Scheme (2022) and minimum energy efficiency standards (2025–2030), confirm that the government views this as a permanent and valued component of the housing mix.
The single biggest complaint about share houses is the shared bathroom. Purpose-built co-living removes it.
Ask anyone who has lived in a traditional share house what they liked least, and the answer is remarkably consistent: sharing a bathroom. Queueing in the morning, cleaning disputes, and the loss of privacy are the friction points that make people leave share housing as soon as they can afford to.
Purpose-built co-living is designed around that reality. Private rooms with private en-suites give residents the affordability of shared housing with the privacy of their own home. Residents get their own space and their own bathroom; the shared kitchen and living areas remain places people choose to use, not queues they are forced to join.
Shared bathroom, shared everything
Private room + private en-suite
Residents stay longer, demand stays stronger
A product tenants genuinely prefer is a product that stays occupied — and occupancy is what investors are really buying.
Many Australians already own land that could serve this documented housing need
The data shows that demand for shared accommodation is concentrated in suburban Melbourne and regional Victoria. These are areas where many homeowners aged 45 to 60 already hold property, often on generous blocks with redevelopment potential.
The western Melbourne corridor (Cobblebank, Melton, Caroline Springs) recorded the fastest group household growth. South-east Melbourne (Dandenong, Monash, Whitehorse) has the largest existing concentration of registered rooming houses. Regional centres like Geelong, Ballarat, and Shepparton are also experiencing growing demand.
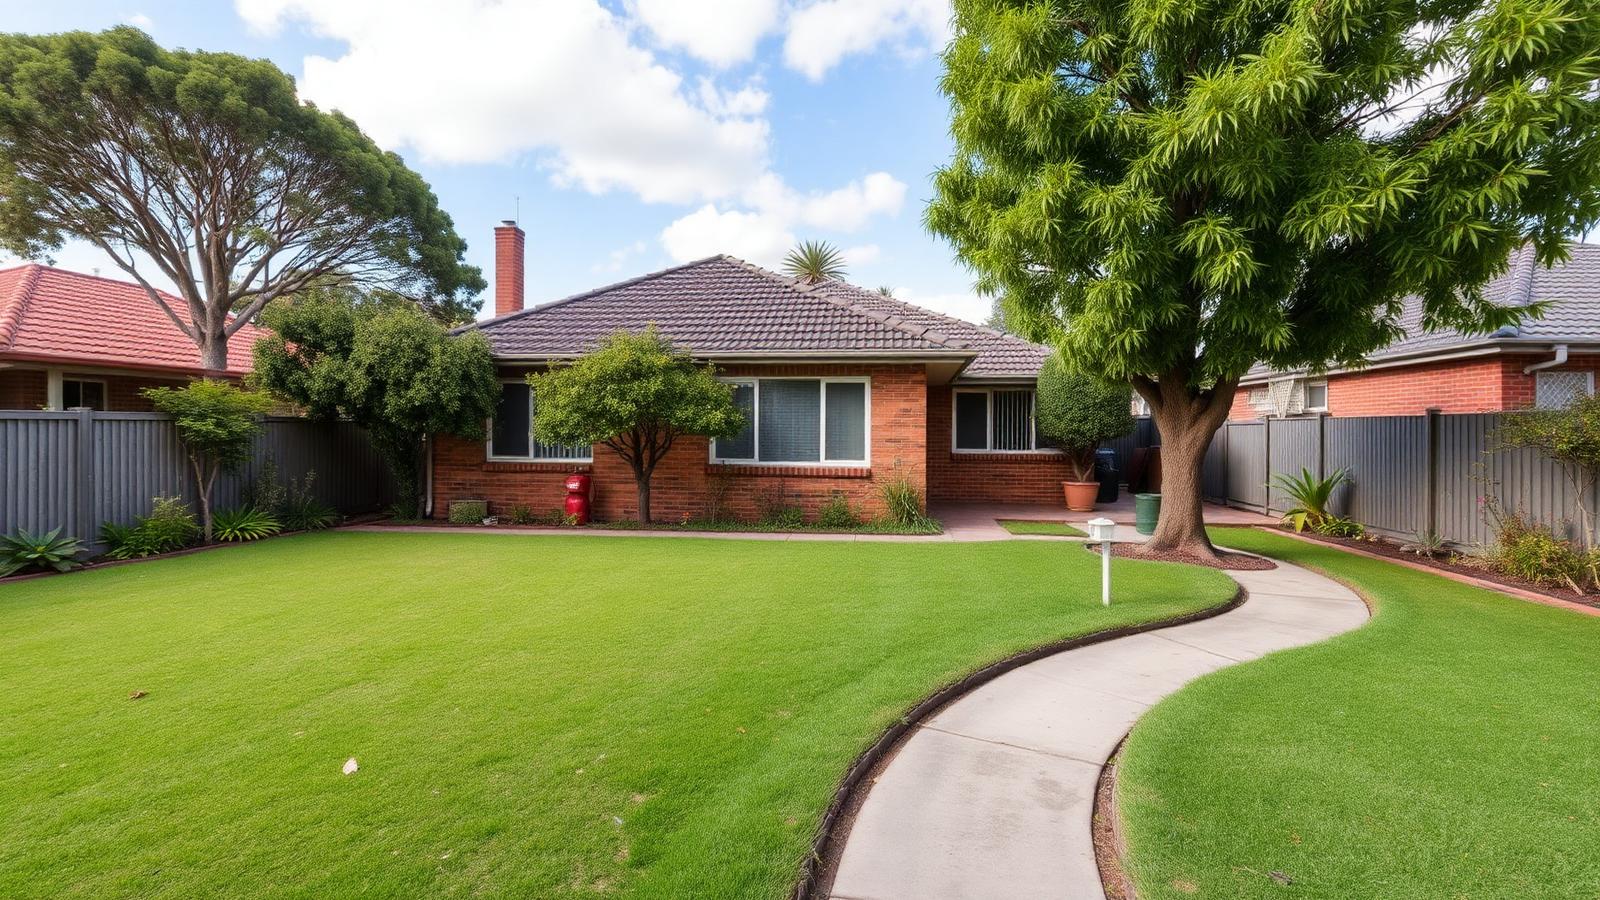
Your block may already be capable of more than you think
A free land assessment tells you whether your land size and zoning suit a purpose-built co-living design — and what rental income it could realistically support.
Free. No obligation. Factual answers only.
Shared accommodation demand in Victoria is not evenly distributed
Strongest concentration is metropolitan Melbourne, then major regional university and service centres, with lower concentration in smaller regional towns.
Five named market clusters
Universities, hospitality jobs, CBD access, high turnover
Young professionals, lifestyle renters, strong rail/tram access
Value-driven demand with strong transport
Universities, hospitals, migrant renter demand
Price-sensitive demand, spillover from higher-cost areas
Shared housing is no longer confined to inner-urban lifestyle suburbs — the addressable market now spans a much wider metropolitan footprint.
- Demand is deepest in inner Melbourne but now spans middle, outer and regional markets — the opportunity set is wider than most assume.
Indicative room rents from current Flatmates.com.au listings — July 2026
Indicative live listing evidence only. Actual rents vary by property, room, inclusions and season.
Investor takeaway: the pricing spread shows shared housing is not just an inner-city premium product, and there is enough price variation to support multiple operating models — from budget share houses to higher-service co-living with bills included.
Rental figures shown are indicative only and not set in stone. Actual per-room rents can be higher or lower depending on the design, specification, and management of the co-living property — well-designed homes in outer suburbs and regional areas can outperform inner-suburb figures. For example, a recent rental appraisal received by Enable Group for a purpose-built co-living design outside Geelong indicated $360–$400 per room per week — above many inner and middle-suburb indicative rents shown here — driven by the quality of the design.
The share-housing market is spreading outward — and broadening demographically
Flatmates-related reporting (late 2024, realestate.com.au) found room rents in several Melbourne suburbs rose 43% to 80.6% over 12 months, explicitly linked to stronger share-housing demand amid living-cost pressure.
Strongest growth occurred outside the classic share-house core — Hampton, Ringwood East, Burnside, Flemington, Essendon West, Seddon, Blackburn North, Nunawading, Sunshine West, and Burnley — evidence the market is spreading across the metro area as renters make price-location trade-offs.
Demographics are also broadening: growing participation from renters aged 55+, single parents, and affordability-driven households. Shared housing is evolving from a life-stage product into a broad affordability response, making the demand base wider and more resilient across cycles.
Low vacancy strengthens the case for room-by-room product
REIV 2026 data — Victoria overall sits in the low-to-mid 2% range, with regional Victoria slightly tighter than Melbourne.
Some localities remain extremely tight — SQM Research's public data showed Lilydale at 0.08% vacancy.
Low vacancy means renters have fewer self-contained alternatives, making rooms in co-living projects easier to fill and supporting occupancy. Best conditions combine low vacancy, high whole-dwelling rents, a large renter base, and room-rent price points that beat studio and one-bedroom alternatives on value.
A full suburb-by-suburb vacancy table for the ranked suburbs requires paid REIV/SQM locality data.
- Vacancy in the low 2% range means rooms fill.
- Low vacancy plus high rents is the backdrop co-living thrives in.
A directional demand screen for Victorian shared-housing markets
Fifty Victorian suburbs ranked by directional demand for shared housing — informed by live Flatmates activity, established share-house guidance, and room-rent growth reporting.
Shared housing already culturally normal, strong renter turnover — easiest to test managed co-living, but more expensive with more competition.
Often the most interesting risk-adjusted opportunities — visible and growing room demand with more achievable acquisition economics.
Not "no demand" — thinner evidence and liquidity. May only work near specific anchors (campus, hospital, transport node).
Ranking is a guide. Your land and design decide the outcome.
Whether your suburb is ranked 5th or 45th — or not listed at all — the achievable result comes down to your specific block and the design built on it. A free land assessment gives you the answer for your address, not the average.
The tenant base is broader — and that changes what to build
Good locations, furnished, low setup cost — supports premium rooms near jobs and transport.
Older singles and separated adults staying in established suburbs — live seeker listings include people aged 49+. Broadens the market beyond students.
Lower weekly cost and greater flexibility — shared housing as an affordability response.
Bills-included, short commitments, easy move-in — supports furnished all-inclusive product.
Room products may need dual-occupancy flexibility.
Platforms emphasise routines, safety and household fit — management quality becomes part of the product.
Product design implication: a more diverse tenant mix means private en-suite bathrooms and private rooms lead the design brief, followed by sound separation, room size, secure access, and well-managed common areas. Professionally managed co-living with resident screening can capture higher occupancy and stronger room rents than informal share houses — reinforcing why purpose-built design is the point.
- The tenant base now spans professionals, over-55s, couples and single parents — a wider market means more resilient occupancy.
Key indicators from public sources
Compiled from publicly available government and institutional research sources.
Purpose-built co-living is growing nationally as a response to documented demand
According to Knight Frank (January 2026), Australia's purpose-built co-living sector now has over 10,000 units in various stages of development nationally. The average scheme size has grown from 37 units (completed projects) to 130 units (projects in planning).
Source: Knight Frank, January 2026; JLL Q2 2024
Enable Group exists because the demand for better shared housing is real, documented, and growing.
The data in this report is the reason Enable Group made purpose-built co-living and rooming houses our core business. We looked at the same Census figures, the same AHURI projections, and the same supply shortfall numbers that you have just read.
We are builders. We saw a housing need that was not being met by conventional construction. Standard homes being converted into share houses without proper design, without adequate amenities, and without professional management.
Our core business strength is building properties that meet the demands of today's society: co-living dwellings, rooming houses, SDA, dual key homes, and duplexes. These are direct responses to documented, structural housing demand.
We do not provide financial advice, investment advice, or property advice. We are builders who responded to what the data was telling us.
This is not what we do on the side. It is our core business.
Most builders build standard homes, and take on rooming houses or co-living projects as occasional side work. Enable Group is the opposite. Specialised, high-compliance assets are what we do every day — purpose-built co-living and rooming houses, Specialist Disability Accommodation (SDA), childcare centres, and medical centres.
These asset classes share one thing in common: they cannot be built like a standard home. They carry specific regulatory, licensing, accessibility, and design requirements, and getting them wrong is expensive. Building them correctly, from the first drawing, is a specialisation — not an add-on.
We are not a volume builder. We are a high-compliance build specialist. That focus is what allows a design to achieve outcomes like the Geelong appraisal referenced earlier — where the quality and compliance of the design, not the location or room count, drove the result.
Purpose-built, licensed under Victoria's rooming house framework
Built to SDA design standards and compliance requirements
Regulated early-childhood facility construction
Healthcare-grade fitout and compliance
Licensed for both residential and commercial builds
Enable Group is licensed to build both residential and commercial projects. That dual capability matters more than it might first appear — because the same rooming house concept can be delivered under two different building classifications.
What many investors are not aware of is that a rooming house can be built as a residential Class 1a building or as a commercial Class 3 building under the National Construction Code. The right classification depends on factors like resident numbers, design, and intended operation — and it changes the compliance pathway, the construction requirements, and how the asset is treated.
This is increasingly relevant for SMSF property investors. Superannuation borrowing rules (limited recourse borrowing arrangements) restrict the ability of an SMSF to borrow to construct residential property, which has pushed growing interest toward commercial build options. Because a rooming house can be delivered as a commercial Class 3 build, this multi-income, multi-tenant design is one that SMSF investors may wish to explore with their advisers.
Rooming house delivered under a residential classification. Familiar residential construction pathway.
Rooming house delivered under a commercial classification. Relevant to investors exploring commercial build structures, including SMSF investors.
Building classification, superannuation, and borrowing rules are complex and depend on individual circumstances. Enable Group does not provide financial, tax, or legal advice. SMSF investors should seek independent professional advice from a licensed financial adviser, accountant, or lawyer before making any decisions.
Volume builders optimise for repetition. High-compliance specialists optimise for getting complex builds right.
- Specialised, high-compliance builds are our core business — residential Class 1a or commercial Class 3, designed for yield, not just room count.
Scenarios where homeowners have explored purpose-built co-living
Bob and Mary's Scenario
The situation: Bob and Mary were thinking of downsizing but did not want to move to a cheaper location just to free up equity for retirement income. They loved where they lived and wanted to stay.
What they discovered: Their current home sat on land that was large enough to build a more suitable home for their needs (3 bedrooms) while converting their high-maintenance backyard into a purpose-built co-living space accommodating 7 residents.
The outcome: Because they already owned the land, there was no additional land purchase and no stamp duty. This cost saving contributed to a positive cashflow property that subsidises their income. They stayed in the location they love.
Illustrative purposes only. Individual outcomes depend on location, land size, council approvals, market conditions, and personal financial circumstances. This is not financial advice.
Wondering if your land could support something similar? Request a free land assessment — we will give you a factual answer either way.
Co-living vs traditional rental — how the income logic differs
Traditional rental leases the whole dwelling under a single agreement — simpler management, but revenue depends on one household. Co-living leases room-by-room, generating multiple income streams with typically stronger occupancy resilience, at the cost of more active management and greater compliance complexity.
- • One lease, one household
- • Simpler management, lower compliance load
- • Indicative gross yield ~3–5%
- • Single point of vacancy risk
- • Multiple leases, diversified income
- • Higher operating cost & compliance load
- • Indicative gross yield 6–15% (7%+ considered strong)
- • Worked example cited: ~3.5% traditional vs ~8.7–9.2% co-living on same asset
One property, multiple income streams — vacancy resilience in practice
When one tenant leaves a traditional rental, rental income drops to zero until it is re-let. When one resident leaves a 7-room co-living property, six income streams continue — roughly 86% of income keeps flowing while one room is re-let.
Income falls to zero until the whole dwelling is re-let.
Six rooms continue paying — roughly 86% of income keeps flowing.
Illustrative only. Actual occupancy and re-letting periods vary.
Gross income per property · net operating income after outgoings · occupancy stability · capex / fitout requirements · operational burden and compliance risk. Co-living is strongest where traditional rents cannot justify site cost on a single lease but room-by-room pricing produces better yield on cost. Treat it as an operating model, not an asset class.
Design over room count: Maximising yield is not always about maximising the number of rooms. Better design frequently outperforms more rooms — quality of layout, privacy, amenity, and specification drive what each room can command. A recent rental appraisal received by Enable Group for a purpose-built co-living design outside Geelong indicated $360–$400 per room per week — above many inner and middle-suburb indicative room rents — driven by the quality of the design rather than the location or room count. This design-led approach to yield is central to how Enable Group builds.
Yield figures are commercial market commentary (Harmony Group, Dixon Advisory) — not audited benchmarks and not financial advice. Actual outcomes depend on location, planning, build spec, operating structure, and market conditions.
- Co-living can out-earn a traditional rental on the same land — but only when design, compliance and management are done properly. That's the specialisation.
See what a design-led approach could achieve on your land
The Geelong example above wasn't about location or room count — it was design. A free land assessment shows what a purpose-built design could achieve on your specific block.
The best opportunities combine five traits
That points to inner and middle-ring Melbourne first, then selective major regional centres. The Victorian shared accommodation market is not speculative in demand terms — the investor question is where product, price, planning, and operations can be aligned to capture it compliantly and at scale. The combination matters: a design tenants prefer — private rooms and private bathrooms — is what sustains the multiple income streams investors are seeking.
Find out what your land could achieve — free, and with no obligation
Every property and every investor is different. We assess your land's size, zoning and design suitability, and return indicative rental potential and build costings. No obligation, no pressure. Just the facts.
No obligation. We will respond with factual information to help you assess your options.
Prefer a broader conversation about suitability and costings? Enquire here.